IMDEA Networks

How to get the most out of the tests
24 April 2020

With COVID-19 hitting all areas of our lives, there is a need both socially and politically to know what the state of the citizenry is. We need to know how COVID-19 is evolving, how many citizens have it, how and where they are infected, what is the probability of them getting sick, etc. All these data are necessary in order to take appropriate measures and to know when and how we are going to recover certain areas of our lives and what other aspects are going to change forever.
For more immediate decision-making, what we need is to know, in real time, what the exact state of the citizenry is. To do this, we must be aware of the evolution of the virus in the population. And tests are the only tool we have to achieve this. The way to achieve this is to test the whole population every day to see if they have the COVID-19 or not. But we don’t have enough resources to do this, as there is the capacity neither to manufacture nor perform almost 50 million tests daily. Instead, the best option is to use the few we have in the best possible way.
But those few tests we do have can be used in a variety of ways. Each has advantages and disadvantages. Depending on which usage policy is chosen, you will get a more or less realistic picture of the state of the population.
To understand the effect of each of these options for using the limited number of tests available, we have developed a simulator that reproduces the spread of the virus in a population of 10,000 people. And it is on this population that we apply the different testing policies to observe the effects of each of them.

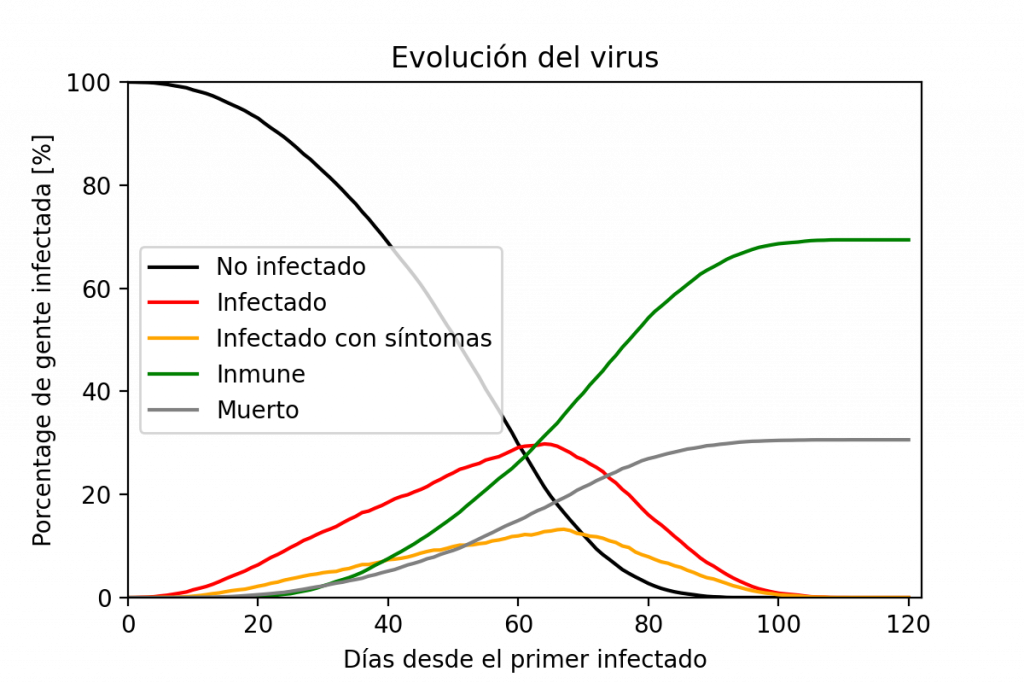
Graph showing the evolution of the population. The number of infected people grows exponentially until there are no longer enough people to feed this rate of infection. Once people start to recover, the number of recovered ones grows. The disease is extinguished when there is no one else to infect.
A simulator is a computer tool that uses mathematical models or rules to imitate the behavior of some aspect of reality. In this case, the simulator developed imitates the spread of the virus in a group of people and the evolution of the infected people over time. The rules of the simulator are the following: every day a probability of contagion is computed depending on the people already infected around and their proximity; once a citizen is infected, he or she has a small daily probability of developing symptoms; those who develop symptoms have a small probability of dying; any infected person who has not died after the time the disease lasts is considered cured and, in the model used, cannot be re-infected so is considered immune.
On the first day, we place a single infected individual in the center of the population. The simulation ends when no one is infected either because all or part of them have died or because all or part of them are immune. In the simulation the number of infected grows exponentially for a while, but then the growth slows down. This is due to two factors: the first is that as the first infected begin to recover, the number of infected drops. In addition, at this point the number of people cured grows exponentially, taking more and more cases away from the statistics of those infected. The second is that there is not an infinite number of people to infect. Once most people in an area are infected, the virus has no new hosts to stay in and over time, as most heal, the number of infected drops. The number of people infected with symptoms is lower than the number of people infected in general, but it follows the same progression for exactly the same reasons. In the simulator we can see this evolution. In real life, unfortunately, we do not have enough tests to know for sure the status of each individual in the population. That’s why we have to decide who to test and who not to test.
We must remember that the final objective is to obtain, as accurately as possible, the number of infected people in this population. For this reason, we are going to use three different testing policies: in the first, only people with symptoms are tested; in the second, the entire population is tested at random but with priority given to people with symptoms; and in the third, tests are done at random without taking into account the symptoms.

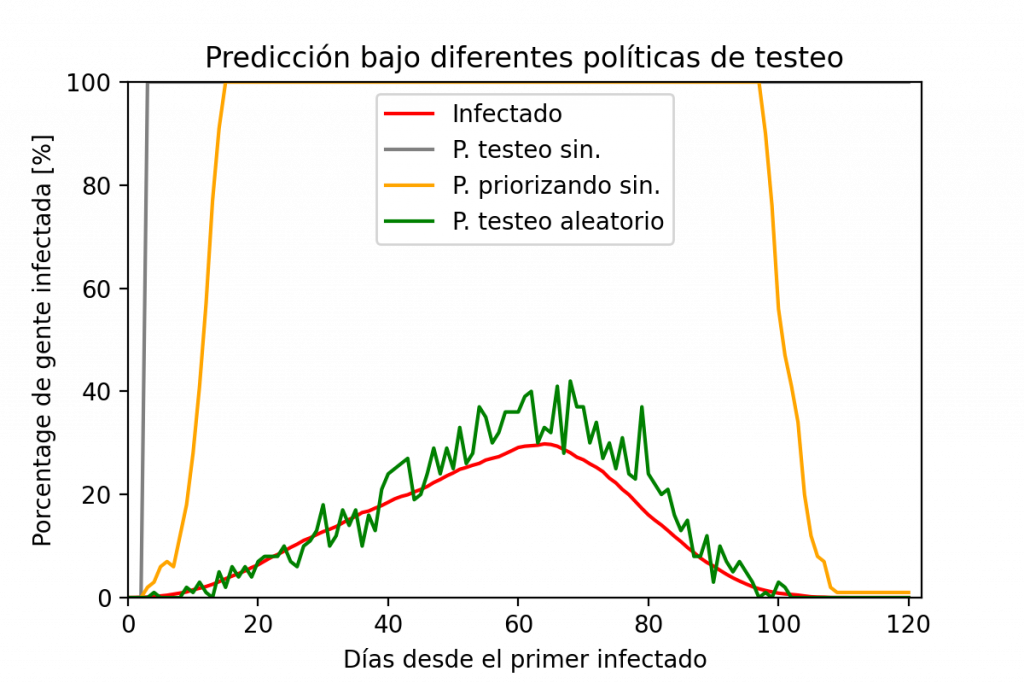
Result of using different testing policies. Note that the best policy is to test randomly. The results are not exact, but the graph reflects the trend. If the tests are focused on a set of the population (such as the symptomatic population), we will be able to know how the symptomatic people are doing, but not the general population.
In the simulation, we have assumed that we are able to test COVID-19 on 1% of the population following the different testing policies. What the simulator shows is that by testing only symptomatic people the data differs greatly from reality. From a statistical point of view, these people do not represent the whole of the population, which is logical because the sample only includes people with symptoms, that is, with a high probability of being sick, and therefore we will obtain a result showing that a large part of those tested is sick. By extrapolating this value to the whole population, the result will be that many have the virus.
Something similar happens when we prioritize tests on symptomatic people, and we do it in a random manner on the rest. When there are few symptomatic people the extrapolation gives good results but when we start to prioritize symptomatic people, the data become unrepresentative again.
This is probably the reason why governments that follow these methods do not make extrapolations to the total population, precisely because they would not be statistically valid. For this reason, the data on confirmed cases that many governments provide, although they may be useful for us to have a lower level, are mathematically incomplete and do not allow us to understand the reality in which we are living.
From a purely statistical point of view, to be able to extrapolate, we have to test a set of the population that represents the entire population. Unless there is a better policy, what is usually done is to choose the subjects of the test at random. As with all predictions, the data are not exactly the same as the actual data, but the trend of the curve is accurately adjusted to reality using a small amount of resources.
Of course, this is only one side of the problem. It is quite possible that in some cases attempts are made to prioritize the tests on hospitalized people out of fear of infection of medical staff and other patients, or because the patient’s treatment may change depending on whether he/she tests positive or not. In Spain, one of the problems with testing is that each autonomous community has followed its own testing policy. Some of them have changed the criteria, from not testing to testing only hospitalized patients. Last week the Spanish government required that results be reported in a specific format to avoid this. And from next week a large randomized study will begin to test some 60 000 people.
Without these tests, and unless we look for some alternative way to find out the state of the population (like the one led by Dr. Antonio Fernandez Anta of IMDEA Networks, with daily surveys on how many sick people you know at http://coronasurveys.org in which the whole population can participate), we are resigned to fighting the virus with one arm tied behind our backs and one eye covered, since to minimize losses and prepare as best as possible, it is necessary to know what we are fighting against. And today we do not know.
This article aims to explain a mathematical concept and its implication in decision-making. The simulations carried out in it are intended to explain this concept. We have sought to ensure that the model matches reality, but like any model, it has its limitations. This model does not represent the current and future state of any region.
Article written by Ander Galisteo, predoctoral researcher at the IMDEA Networks Institute and the University Carlos III of Madrid (UC3M).
More info
- Personal website of Ander Galisteo
- Math to explain the measures against the coronavir
- Why we need more tests to understand COVID-19


Recent Comments